We just launched a new template! Project Tracker [LITE]! 🎉🎊
Get Total Project Clarity in Under 30 Minutes — Without Building Anything From Scratch
Have you ever felt that the current tools to create a Gantt chart are too complex? Have you ever wondered if there is anything simpler or faster to help with your initial planning?
Sometimes, when we start to plan a project, all we want and need is a simple timeline tool that can help us lay down the main tasks in a Gantt chart format.
Creating an Excel Gantt Chart can seem daunting, but you can easily create a professional-looking chart for your project with a few simple steps.
What is a Gantt Chart?
A Gantt chart visually represents a project schedule and displays activities as bars along a timeline. Each bar represents a specific task, its start and end dates, and its duration. The significance of Gantt charts in project management lies in their ability to:
- Visualise Project Timelines: Gantt charts provide a clear and intuitive view of when each task starts and finishes, allowing project managers and team members to see the entire project timeline at a glance.
- Task Dependencies: They show dependencies between tasks, helping to identify which tasks must be completed before others can begin, which is crucial for effective project planning.
- Resource Allocation: Gantt charts enable managers to allocate resources efficiently by showing when team members are needed for specific tasks.
- Progress Tracking: They help monitor project progress by comparing planned vs. actual timelines. Deviations can be easily identified and addressed.
Project managers can use Gantt charts to schedule tasks, set milestones, and adjust as project circumstances change, ensuring projects stay on track. A Gantt chart can also serve as a communication tool, enabling PMs to share project plans with stakeholders, team members, and clients in a visual and easy-to-understand format.
In summary, Gantt charts are a fundamental tool in project management that aids in planning, organising, and tracking tasks to ensure projects are completed efficiently and on time.
Do I really need all of that?
That’s a great question, and I constantly ask myself when planning a project.
While Gantt charts are a popular choice due to their ability to display dependencies and resource allocation, it’s important to remember that every project is unique. Sometimes, we need a clear timeline highlighting the project’s main activities to facilitate discussions and revisions.
Why Excel?
Many people tend to use MS Project Professional as their go-to app for creating Gantt charts. While MS Project is undoubtedly a powerful tool for this purpose, it has a significant drawback – the inability to enable real-time collaboration. Microsoft has attempted to address this issue by releasing Project Server with Project Web Access (PWA), which allows users to share and edit MPP files but still doesn’t enable real-time collaboration. Microsoft Project Online, which is included in the Microsoft 365 package, was also released later, but it has a limitation of 500 tasks/lines and can become slow beyond the 200 tasks mark.
Several other apps and web-based tools have been launched in the past few years, which pose a challenge to MS Project’s dominance in this area. However, not all companies are willing to switch to new apps for managing their projects.
That’s where Excel comes into the picture. Everyone has access to it since it is already included in the MS 365 package. Furthermore, it enables real-time collaboration, making it an ideal choice for initial project planning and collaboration.
In this post, I will show you how to create an Excel Gantt chart. We will use formulas and conditional formatting, which makes it easier to expand it when required. This chart will display a timeline of activities based on their start and end dates. Once you’ve completed this chart, you can add information about the duration of each activity and the resources required for each task.
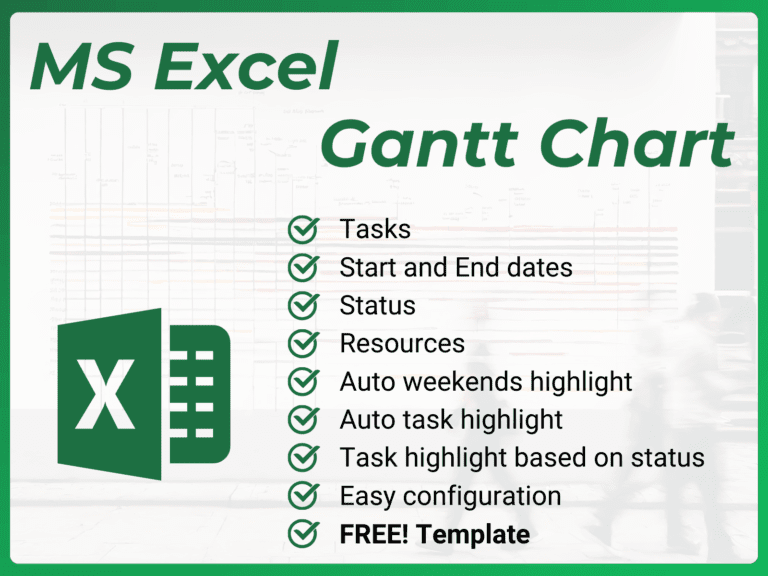
Download this template for free!
Download here!
Excel Gantt Chart
Part 1: Creating the table and timeline
- Create a table in Excel with the following columns: Task Name, Start Date, End Date, Progress, Status and Resources.
- Populate each column (left to right) with a day for the period you want to cover on your plan. Suggestion: use three lines for this: First line – Month; Second – Weekday; Third – Day of the month
- Your table should look like this:

Before moving to the Gantt chart, let’s prepare the Status and Resources columns.
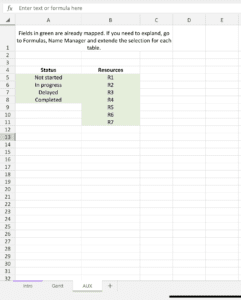
Create a supporting tab, let’s call it “Aux”. Inside the tab, create two lists: Status and Resources.
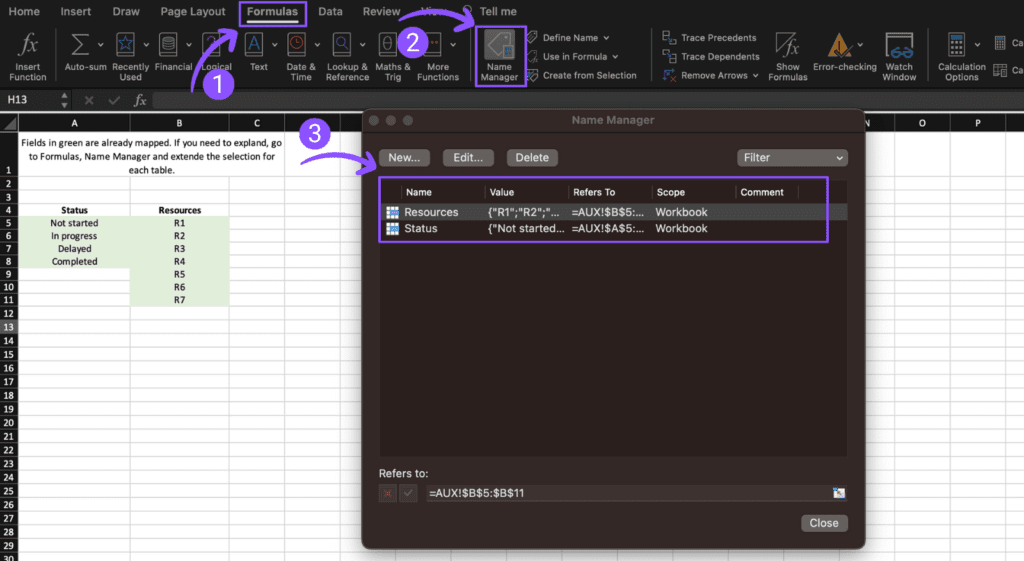
Map each list using the Formula -> Define name function. For this exercise, I will use the same name at the top of the list: Status and Resources.
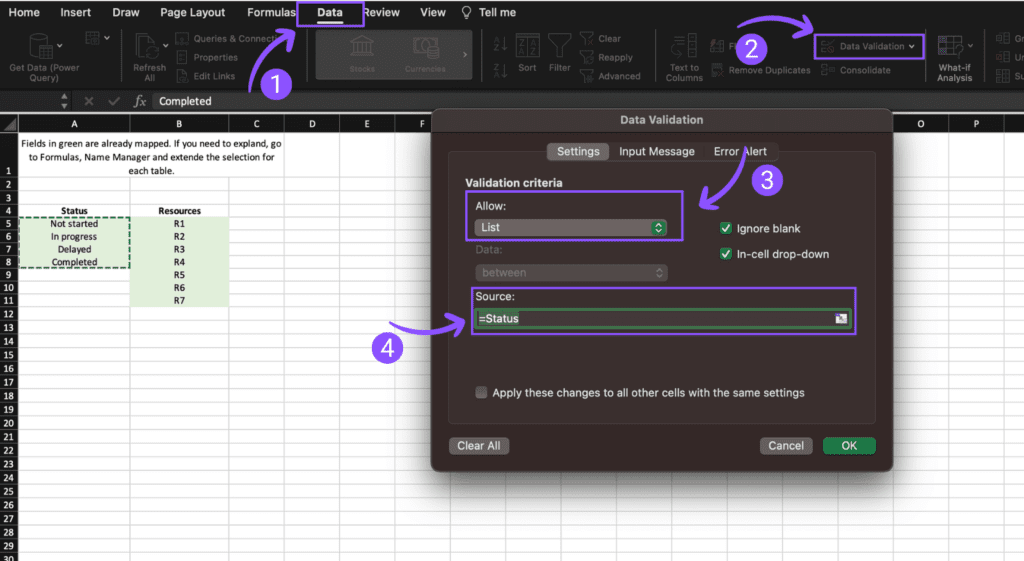
Back to your Gantt Chart table, select all cells in the Status column and open the Data Validation function.
Select List, and in the field, type the name you gave to the list starting with ‘=’. For this exercise, type =Status
Repeat the process for the Resources column and use =Resources
- Now, you have two columns with a drop-down that you can use to select the available options.
Part 2: Creating the Gantt Chart
- Fill three lines with the task name, start date and end date columns. This information will help you prepare the formulas to create the Gantt chart.
The first formula will be the weekend validation — update cell G4 with the following formula. Copy and paste from G4 to AC12.

- This formula checks which day is a weekend and returns the letter “w”. WEEKDAY function uses 1 for Sunday and 7 for Saturday.
=IF( OR(WEEKDAY(G$3)=1,WEEKDAY(G$3)=7), "w" , "")
- Now that weekends are correctly identified, let’s change the formula to highlight if the day (in line 3) is between the start and end dates. Replace” “for the following formula, copy and paste from G4 to AC12.
IF(AND(G$3>=$B4,G$3<=$C4),"g","")
- Your formula and timeline should now looks like this:
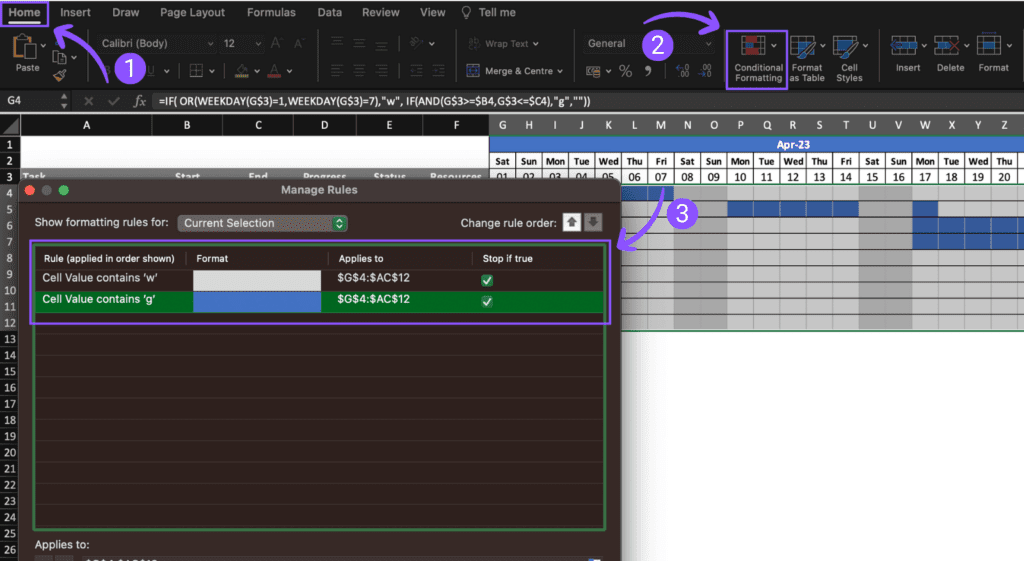
=IF( OR(WEEKDAY(G$3)=1,WEEKDAY(G$3)=7),"w", IF(AND(G$3>=$B4,G$3<=$C4),"g",""))
- As a last step, we will create conditional formatting rules to add colour to each cell. Add one rule highlighting “w” in grey and “g” in blue.
- Once done, your Excel Gantt Chart table should look like this:
Additional formatting
If you want to take this Excel Gantt chart one step further, add a step in the formula to check if the task is in progress, delayed or complete, and highlight the chart using these colours instead of blue.
					=IF( OR(WEEKDAY(H$3)=1,WEEKDAY(H$3)=7),"w",
        IF(AND(H$3>=$B5,H$3<=$C5),
                IF($E5="Completed","c",
                    IF($E5="Delayed","d",
                        IF($E5="In progress","g","n")
                    )
                ),""
        )
    )
Final thoughts
Creating a Gantt chart is an essential step in project management, and Excel is a great tool to achieve it. By following the steps outlined in this article, you can easily create a professional-looking Gantt chart that will help you visualise your project timeline, dependencies, and progress. Whether you’re a seasoned project manager or just starting, using an Excel Gantt chart is a smart way to stay on track and ensure your project is completed efficiently and on time.
Always start with a small plan and gradually add more information as needed. Avoid creating an initial plan that is overloaded with too much information, as it can be complex to use and challenging to keep it updated. Remember, even the biggest accomplishments start with a small plan. So, take that first step with confidence and watch your plan grow into something extraordinary.
I hope you found this article helpful. Did you get a chance to use the provided template? I’d love to hear about your experience, so please feel free to share in the comments below. See you in our next post!
YouTube video – Step-by-step
Do you want a more deatiled step-by-step guide on preparing this Excel Gantt chart template. Take a look at my YouTube video where I go through all the options and functionalities used in the template.
